The PK profile Validation Function
We all use WAPPS to optimize the care of our patients. We know how good it is and we know its limitations. We have learnt it by doing, as it often happens in hemophilia.
Many of you, I am sure, have “informally” verified the goodness of WAPPS predictions by comparing a random plasma factor level measurement with the predicted concentrations.
Going forward, we’ll have the opportunity to enter one plasma factor activity level measurement and compare it with the predicted concentration.
WAPPS will do this for you, in real-time and with a fully automated mechanism; the only requirement is that the measurement needs to be after the infusion of the same concentrate used for the PK study you are going to validate. But all the rest (e.g. dose, weight of the patient) can vary. WAPPS will take care of predicting the concentration at the time of the measurement you provide, based on the PK profile you intend to validate, using the appropriate dose and patient covariates.
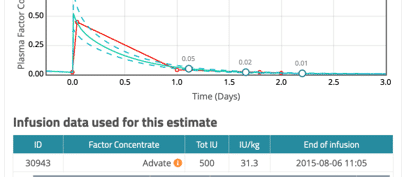
Before telling you how to input a validation point, let’s look at what you get back (Figure 1):
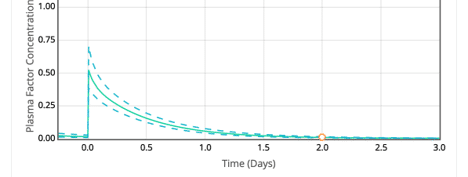
From right to left, you have the following:
- Time = the time of the validation sample
- Predicted = the predicted concentration at “time”
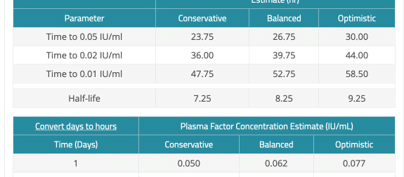
- Prediction interval = the variability around the prediction (the lowest and highest likely values)
- Observed = the measured level you have provided
- Absolute difference = Observed – Predicted
- Observed within predicted interval = this will be set to v if the observation falls within and x if It falls outside of the prediction interval
- Clinically relevant difference? = this is a question you will need to answer; the difference may be “statistically significant” (Observed within predicted interval) or not, but in either case may or may not be clinically relevant (i.e. lead to a change in the management of the patient). Please select “Yes” if you judge the difference is clinically relevant, and “No” otherwise.
After you record your judgement, you will be able to access the updated PK (Figure 2a and 2b)
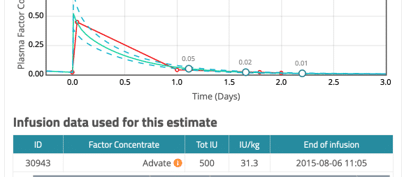
By clicking on the tab floating over the results you can toggle between the original and updated PK and compare them. Also, you will be able to indicate whether you want to use the updated PK in the clinical calculator if you like (Figure 3).
The validation point function is created to let you verify how good WAPPS-Hemo is for each of your patients. We suggest that you draw a sample when you clinically assess your patients, and you input it as validation point. This will confirm the prediction is (or is not) good for that specific patient, and the sum of all the individual validation will give us an idea of how well WAPPS performs.
We invite you to input as many validation points as you can (even retrospective data will be valuable); the goal is to reach 500 validation points as fast as we can, and calculate how many time the prediction is concordant/discordant in a statistical and clinically relevant way.
Inputting a Validation Point
Inputting a validation point is easy:
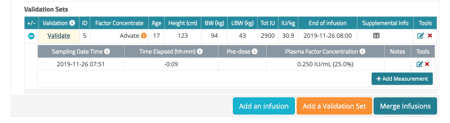
On the patient page (Figure 4), you click on the “Add validation point” icon
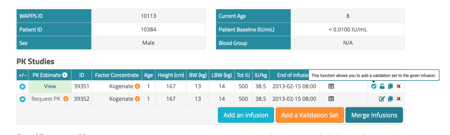
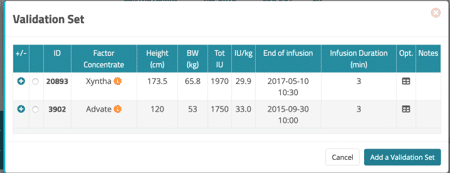
Then select the infusion you want to validate (Figure 5)
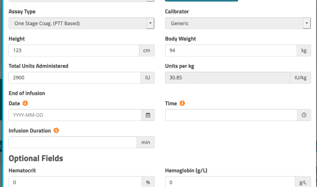
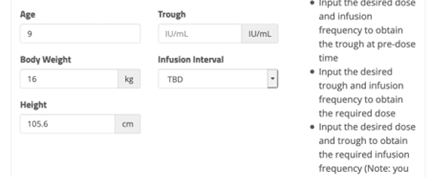
And add the dose and time of infusion (Figure 6), exactly as when recording a PK study, with the sole difference that the concentrate will be “set” to the same as the PK study you indicated you want to validate.
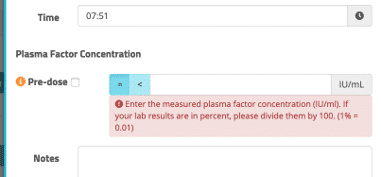
Lastly, you will add your measurement data using the same input screen used to report measurements of a PK study (Figure 7)
Finally, click on “validate” to get the results (Figure 8)
When the results appear, the second tab (validation point, to the right of PK estimate) gets in focus, showing the content in Figure 9.
Validation Point Results
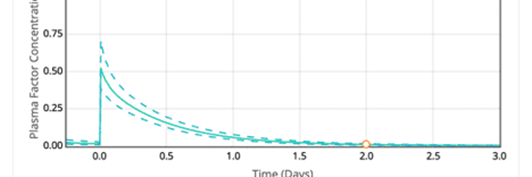
Figure 9
From right to left (Figure 9), you have the following content:
- Time = the time of the validation sample
- Predicted = the predicted concentration at “time”
- Prediction interval = the variability around the prediction (the lowest and highest likely values)
- Observed = the measured level you have provided
- Absolute difference = Observed – Predicted
- Observed within predicted interval = this will be set to v if the observation falls within and x if It falls outside of the prediction interval
- Clinically relevant difference? = this is a question you will need to answer; the difference may be “statistically significant” (Observed within predicted interval) or not, but in either case may or may not be clinically relevant (i.e. lead to a change in the management of the patient). Please select “Yes” if you judge the difference is clinically relevant, and “No” otherwise.
After you record your judgement, you will be able to access the updated PK on the right-hand tab (Figures below).
The validation point is now added to the series of measurements for the PK study. The information provided is exactly the same as for the standard PK estimate tab.

By clicking on the tabs floating over the results (PK estimate/Validation Point/Updated PK estimate) you can toggle between the original and updated PK and compare them. Also, you will be able to indicate whether you want to use the updated PK in the clinical calculator if you like. There is no right or wrong PK estimate, and sometimes the updated will be more precise, sometimes it will be identical, and some other time you would prefer to keep using the original one
The validation point function is created to let you verify how good WAPPS-Hemo is for each of your patients. We suggest that you draw a sample when you clinically assess your patients, and you input it as validation point. This will confirm the prediction is (or is not) good for that specific patient, and the sum of all the individual validation will give us an idea of how well WAPPS performs.
Training Videos and Tutorials
We have also published a few video tutorials explaining the new PK profile validation point feature.
Introduction to Validation Sets
Inputting a Validation Set
Interpreting the Results
Conclusion
We warmly invite you to provide as many validation points as you can. Our target is 500, which would give us enough data to be able to “externally” and clinically validate WAPPS-Hemo. Depending on the data we will receive we should be able to validate some specific models or characterize the performance of WAPPS-Hemo in children as opposed to adults.
We aim at submitting the results as a scientific paper. Everyone contributing at least 1 validation point will be added to the contributor list. The 10 WAPPS users providing the largest number of points will be invited to co-author the validation paper.
And we will all enjoy the measure of the WAPPS performance!!!